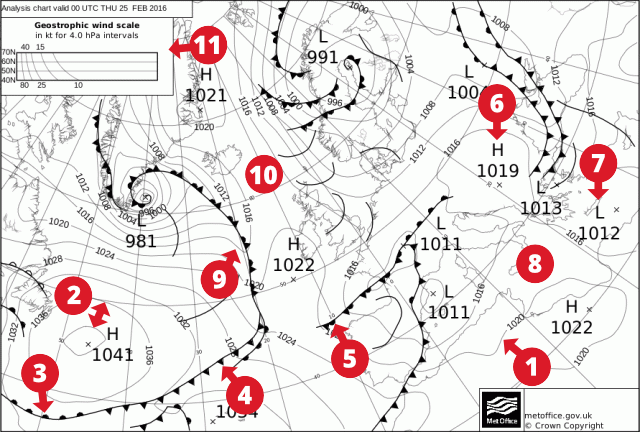
The isobaric map represents the current or forecasted barometric situation with the position of the fronts. There are several types of maps: the surface map (which represents the pressure at sea level) and the altitude maps (representing the geopotential altitude at a given pressure), however the altitude maps are more complex to interpret. A surface isobaric map can be plotted, that is, with wind and pressure readings.
isobaric map
Isobaric. It shows a pressure of 1020 hPa.
Pressure gradient. The space between two Isobars.
Warm front.
Cold front.
Occluded forehead.
Anticyclone. Symbol H, pressure higher than 1013 hPa (here 1019hPa).
Depression. Symbol L, pressure lower than 1013 hPa (here 1012hPa).
Barometric swamp.
Thalweg. The low-pressure system is inserted between the 2 high-pressure systems.
Barometric pass. Calm zone located between 2 lows and 2 highs.
Abacus. Used to determine the wind speed in a zone.
Pay attention to the time of validity of the map and its type (analysis or forecast).
Thanks to the typical disturbance diagram, you can imagine the weather or what it will be like.
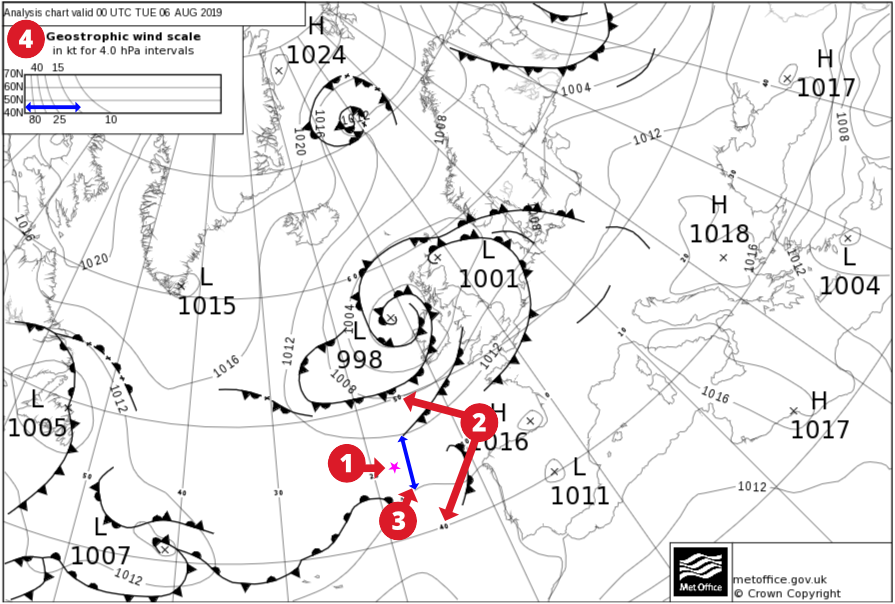
Let’s start by retrieving a weather map with pressures. For example on metoffice.
Choose an area for which you want to estimate the wind. I suggest you to start off Spain at the level of the purple star in 1 on the diagram.
Read the degree of latitude of the zone concerned. It is indicated on the parallels. Look at 2 on the diagram, we are between 40°N and 50°N. Let’s say at 45°N.
Measure (with a compass for example) the distance between 2 isobars in your area, you get the pressure gradient. This is the blue arrow in 3 on the diagram.
Transfer this gap to the chart (top left, at 4 on the diagram) at the right degree of latitude (45°N).
Read on the right side of the deviation, the wind value following the curve. The data are in kt = knots. We are therefore at about 14 knots of wind.
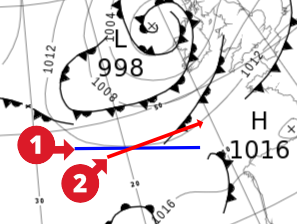
We start by drawing the tangent at an isobaric. Look at the blue line in 1 on the diagram.
Then we draw the wind direction: at 20° from the tangent on the low pressure side (so towards the side of the isobar at 1008 hPa). Look at the red line in 2 on the diagram.
Be careful it’s 20° over the sea, and 40° over the land.
Place the corresponding terms for A to E and give the wind speed and direction in 1 and 2. What type of map is this?
Warm front - Cold front - Occluded front - High - Low
isobaric map
Response
A. Depression - B. High pressure - C. Cold front - D. Occluded front - E. Warm front / 1. speed: About 40 kts - direction: West / 2. speed: About 10 Kts - direction: Northwest / This is an analysis map.